Interface States Examples
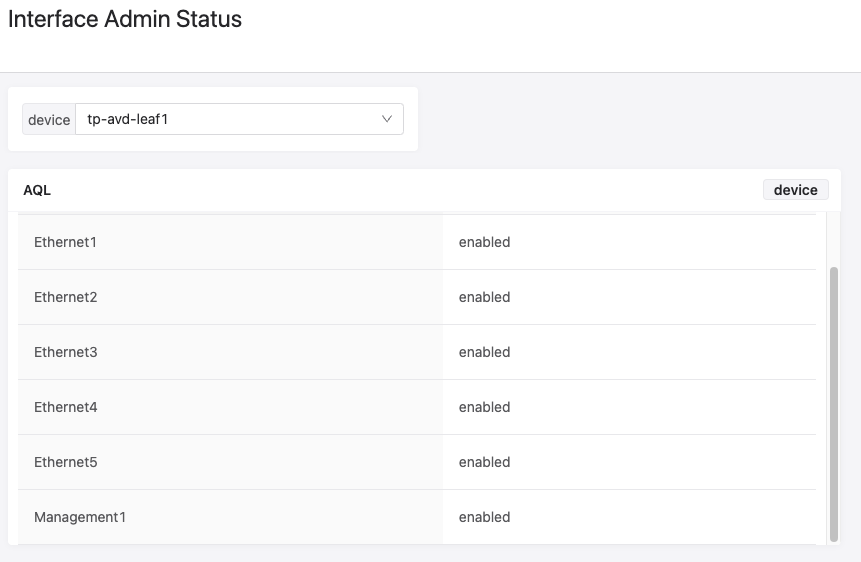
Admin state of interfaces per device
let data = `<_device>:/Sysdb/interface/config/eth/phy/slice/*/intfConfig/*`
let res = newDict()
for cell in data{
    for interface, value in cell{
        let status = merge(value)["adminEnabledStateLocal"]["Name"]
        # if an interface was never shutdown the state is unknownEnabledState
        if status == "unknownEnabledState"{
            let status = "enabled"
        }
        res[interface] = newDict() | setFields("Status", status)
    }
}
res
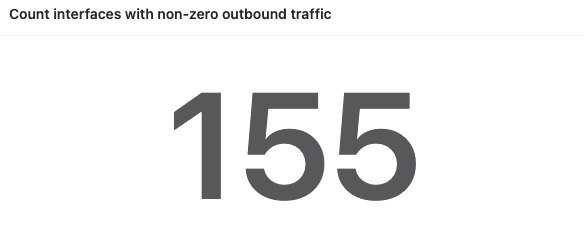
Count interfaces with non-zero outbound traffic
# Get the latest rates value for all interfaces in the network using widcards and apply merge on the inner timeseries
let data = `analytics:/Devices/*/versioned-data/interfaces/data/*/aggregate/rates/15m` | recmap(2, merge(_value))

# keep only entries where the outOctets field is present and avg is non-zero
let latestRatesByInterface = data | map(_value | where(dictHasKey(_value, "outOctets") && _value["outOctets"]["avg"] > 0))

#count the remaining interfaces (with outbound traffic) for each device and compute the sum to get the number of active interfaces in the entire network
sum(latestRatesByInterface | map(length(_value)))
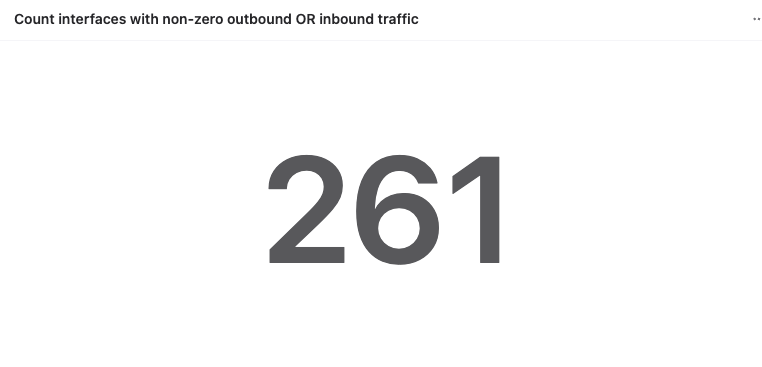
Count interfaces with non-zero outbound OR inbound traffic (with key existence check)
# Get the latest rates value for all interfaces in the network using widcards and apply merge on the inner timeseries
let data = `analytics:/Devices/*/versioned-data/interfaces/data/*/rates`

# keep only entries where the outOctets and inOctets field is present and non-zero
let latestRates = data | map(_value | where(dictHasKey(merge(_value), "inOctets") && merge(_value)["inOctets"] > 0      \
                                     || dictHasKey(merge(_value), "outOctets") &&  merge(_value)["outOctets"] > 0))

# count the remaining interfaces (with outbound traffic) for each device and compute the sum to get the number of active interfaces in the entire network
sum(latestRates | map(length(_value)))
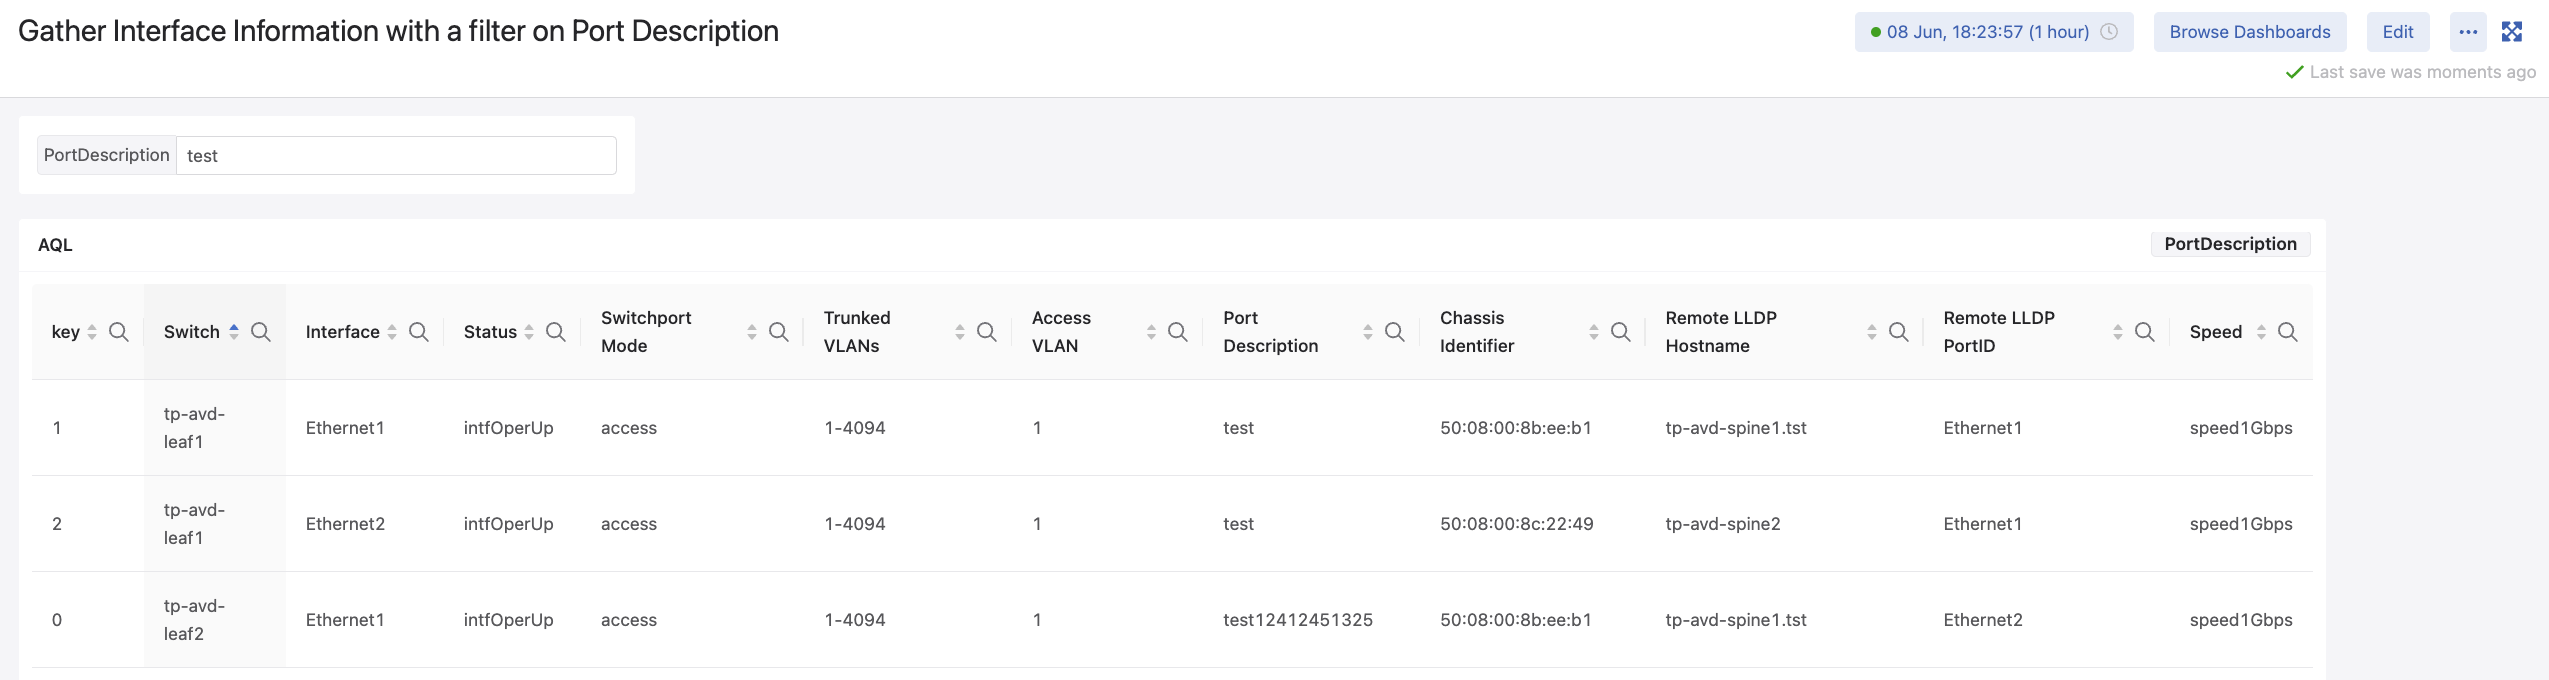
Interface Information wtih a filter on Port Description
# Requires a variable input named PortDescription

# Get the interface names and descriptions
let intfConfig = `*:/Sysdb/interface/config/eth/phy/slice/1/intfConfig/*` | recmap(2, merge(_value))
let i = 0
let result = newDict()
for deviceKey, deviceVal in intfConfig {
    for interfaceKey, interfaceVal in deviceVal {
        if reMatch(interfaceVal["description"], _PortDescription) {
            result[i] = newDict()
            result[i]["Switch"] = deviceKey
            result[i]["Interface"] = interfaceKey
            result[i]["Port Description"] = interfaceVal["description"]
            let i = i + 1
        }
    }
}

# Get the LLDP Neighbour Information
let lldpPeers = `*:/Sysdb/l2discovery/lldp/status/local/1/portStatus/*/remoteSystem/*` | recmap(3, merge(_value))
for deviceKey, deviceVal in result {
    for lldpKey, lldpVal in lldpPeers {
        if lldpKey == deviceVal["Switch"] {
            for interfaceKey, interfaceVal in lldpVal {
                if interfaceKey == deviceVal["Interface"] {
                    let values = interfaceVal[dictKeys(interfaceVal)[0]]
                    result[deviceKey]["Remote LLDP Hostname"] = values["sysName"]["value"]["value"]
                    result[deviceKey]["Remote LLDP PortID"] = values["msap"]["portIdentifier"]["portId"]
                    result[deviceKey]["Chassis Identifier"] = values["msap"]["chassisIdentifier"]["chassisId"]
                }
            }
        }
    }
}

# Get the L2 Interface Information (VLAN Info, etc)
let switchIntfConfig = `*:/Sysdb/bridging/switchIntfConfig/switchIntfConfig/*` | recmap(2, merge(_value))
for deviceKey, deviceVal in result {
    for switchKey, switchVal in switchIntfConfig {
        if switchKey == deviceVal["Switch"] {
            for interfaceKey, interfaceVal in switchVal {
                if interfaceKey == deviceVal["Interface"] {
                    result[deviceKey]["Switchport Mode"] = interfaceVal["switchportMode"]["Name"]
                    result[deviceKey]["Access VLAN"] = interfaceVal["accessVlan"]["value"]
                    result[deviceKey]["Trunked VLANs"] = interfaceVal["trunkAllowedVlans"]
                }
            }
        }
    }
}

# Get the Interface Status Info
let intfStatus = `*:/Sysdb/interface/status/eth/phy/slice/1/intfStatus/*` | recmap(2, merge(_value))
for deviceKey, deviceVal in result {
    for switchKey, switchVal in intfStatus {
        if switchKey == deviceVal["Switch"] {
            for intfKey, intfVal in switchVal {
                if intfKey == deviceVal["Interface"] {
                    result[deviceKey]["Status"] = intfVal["operStatus"]["Name"]
                    result[deviceKey]["Speed"] = intfVal["speedEnum"]["Name"]
                }
            }
        }
    }
}
result
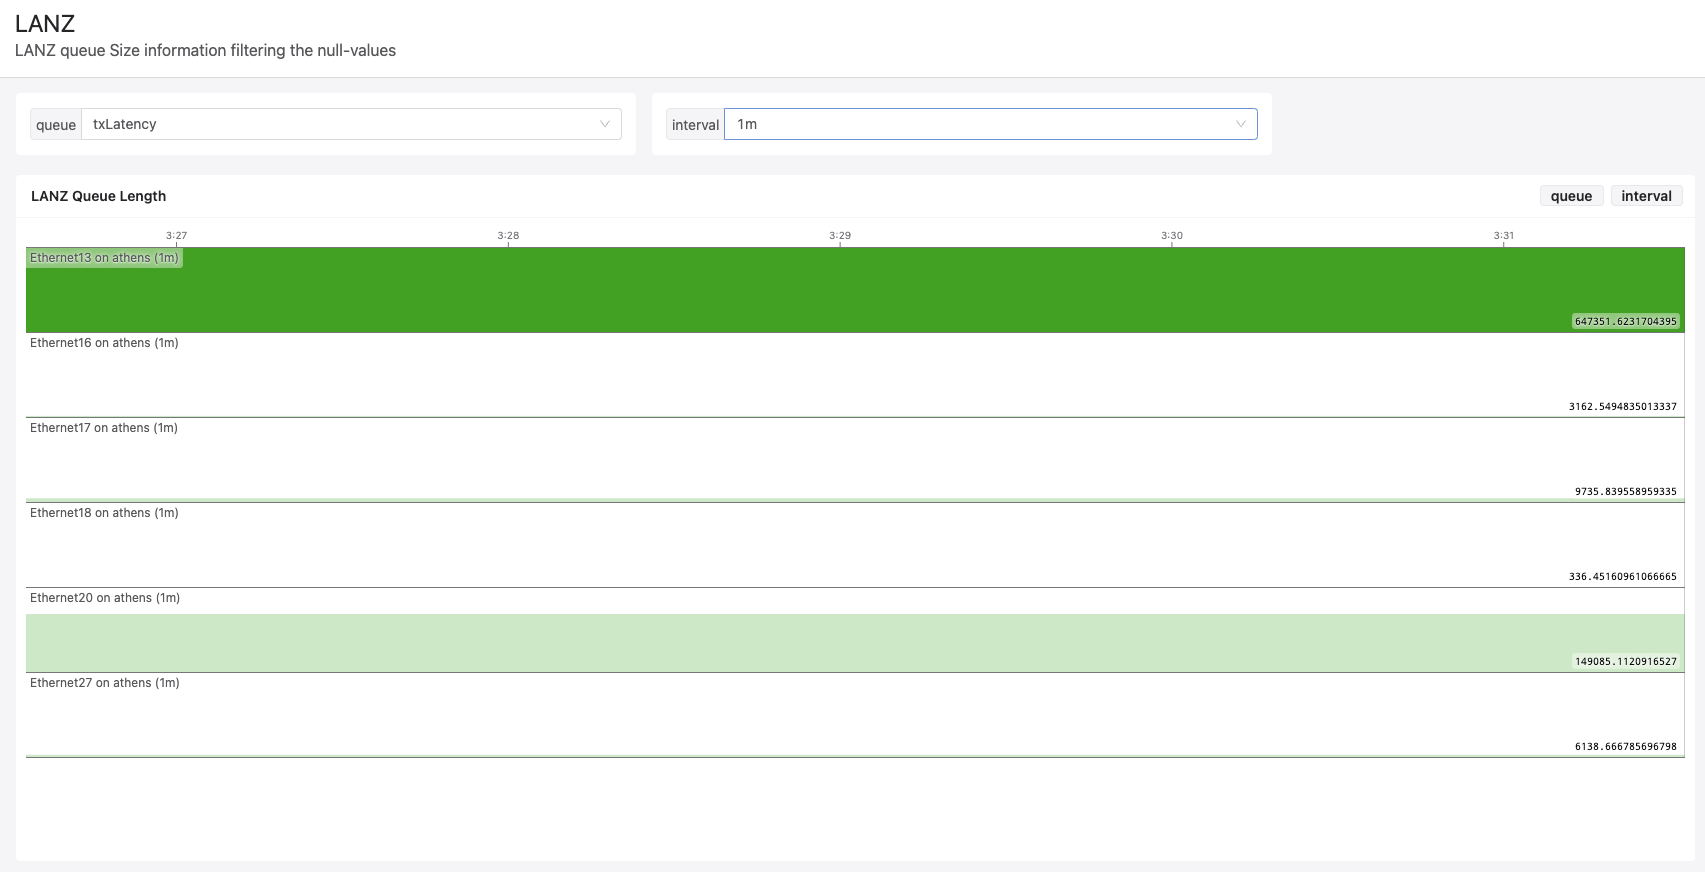
LANZ queue Size information filtering the null-values
let intervalToMonitor = "10s" # Can be "1m", "10s" or "1ms"
let queueToMonitor = "queueSize" # Can be "queueSize" (to monitor queue size), "qDropCount" (to monitor actual drops) or "txLatency" (to monitor Tx latency)

# Section to get a Serial-number to hostname dict (SNToHostnameDict)
let SNToHostnameDict = newDict()
let dataDeviceAnalytics = `analytics:/Devices/*/versioned-data/Device`
for device, deviceData in dataDeviceAnalytics {
   let mergedDeviceData = merge(deviceData)
   SNToHostnameDict[device] = mergedDeviceData["hostname"]
}

# let data = `analytics:/Devices/*/versioned-data/interfaces/data/*/lanz/aggregate-congestion/*`[_timeWindowStart:_timeWindowEnd]
let data = `analytics:/Devices/*/versioned-data/interfaces/data/*/lanz/aggregate-congestion/*`[7*24h]
let result = newDict()
for deviceSN, deviceData in data {
    for interface, interfaceData in deviceData {
        for interval, aggData in interfaceData {
            let empty = true
            for timestamp, timeseriesData in aggData {
                if (dictHasKey(timeseriesData, queueToMonitor) && timeseriesData[queueToMonitor]["avg"] > 0 && interval == intervalToMonitor && strHasPrefix(interface, "Ethernet")) {
                    let empty = false
                }
            }
            if (!empty) {
                let deviceHostname = SNToHostnameDict[deviceSN]
                result[interface + " on " + deviceHostname + " (" + interval + ")"] = aggData | map(_value[queueToMonitor]["avg"])
            }

        }
    }
}
result
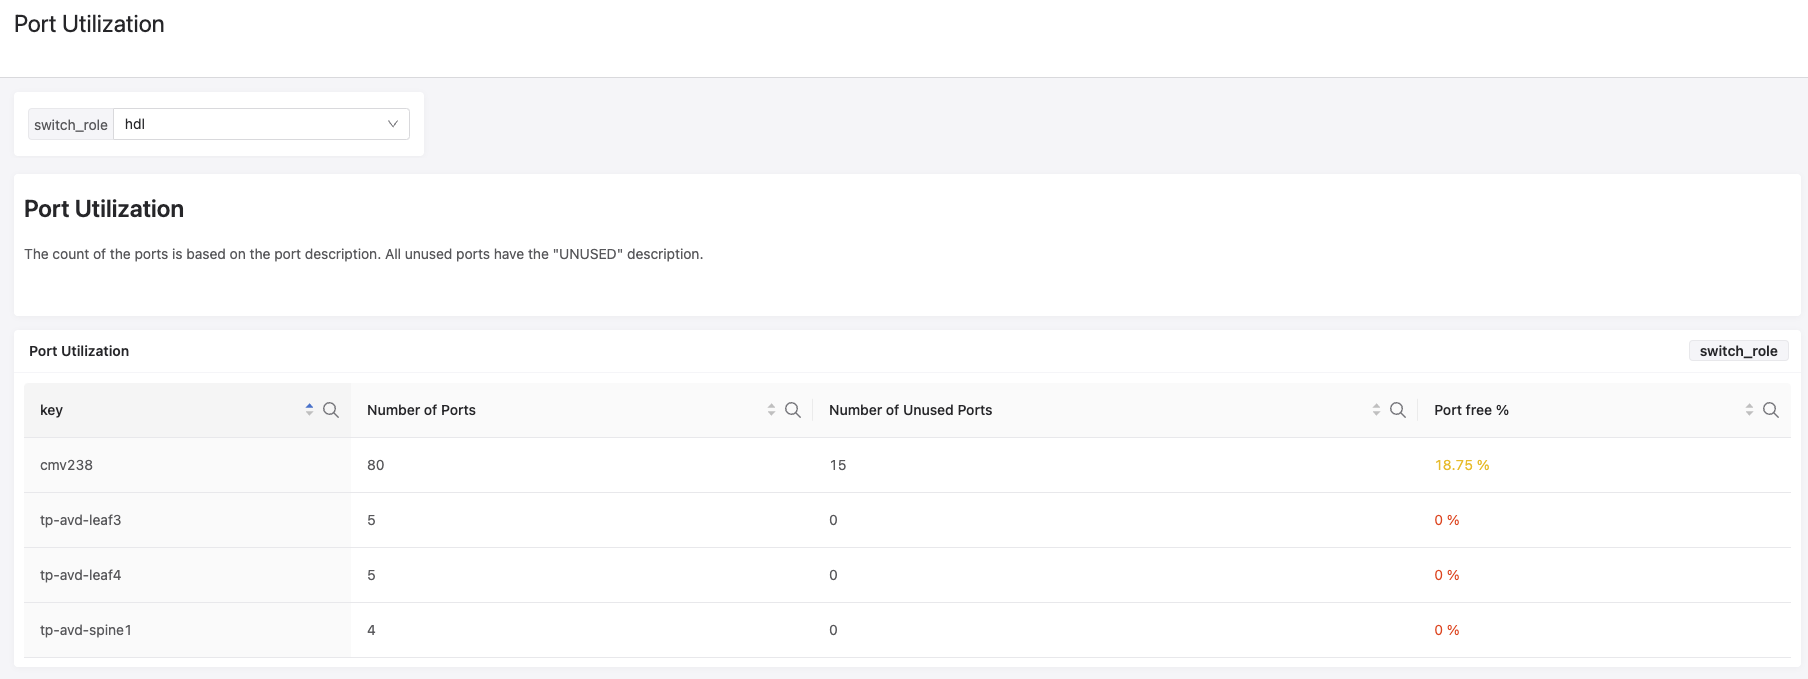
Port Utilization
# Get devices with tag label "switch_role" and default value of "hdl".
# To choose another tag value, select from the input's dropdown.

# Load all interface configurations
let devs = merge(`analytics:/tags/labels/devices/switch_role/value/<_switch_role>/elements`)
let devices = newDict()

for deviceIDstr, val in devs {
    let devId = strSplit(str(deviceIDstr), ":")[1]
    let devId = strReplace(devId,"\"", "")
    let devId = strReplace(devId, "}", "")
    devices[devId] = val
}

let data = `*:/Sysdb/interface/config/eth/phy/slice/1/intfConfig/*` | recmap(2,merge(_value) | fields("description")) | map(_value | where(strContains(_key, "Ethernet")))| where( dictHasKey(devices, _key))
let result = `*:/Sysdb/interface/config/eth/phy/slice/1/intfConfig/*` | recmap(2,merge(_value) | fields("description")) | map(_value | where(strContains(_key, "Ethernet")))| where( dictHasKey(devices, _key))

for deviceKey, deviceValue in data {
    let nbPorts = 0
    let nbUnusedPorts = 0
    for portKey, portValue in deviceValue {
       if (portValue["description"]=="UNUSED"){
        let nbUnusedPorts = nbUnusedPorts+1
       }
        let nbPorts = nbPorts+1
        result[deviceKey]["Number of Unused Ports"] = nbUnusedPorts
        result[deviceKey]["Number of Ports"] = nbPorts
        if (nbPorts != 0){
            result[deviceKey]["Port free %"] = nbUnusedPorts / nbPorts * 100
        } else {
            result[deviceKey]["Port free %"] = "N/A"
        }
    }
}
result | map(_value | fields("Number of Unused Ports","Number of Ports","Port free %"))
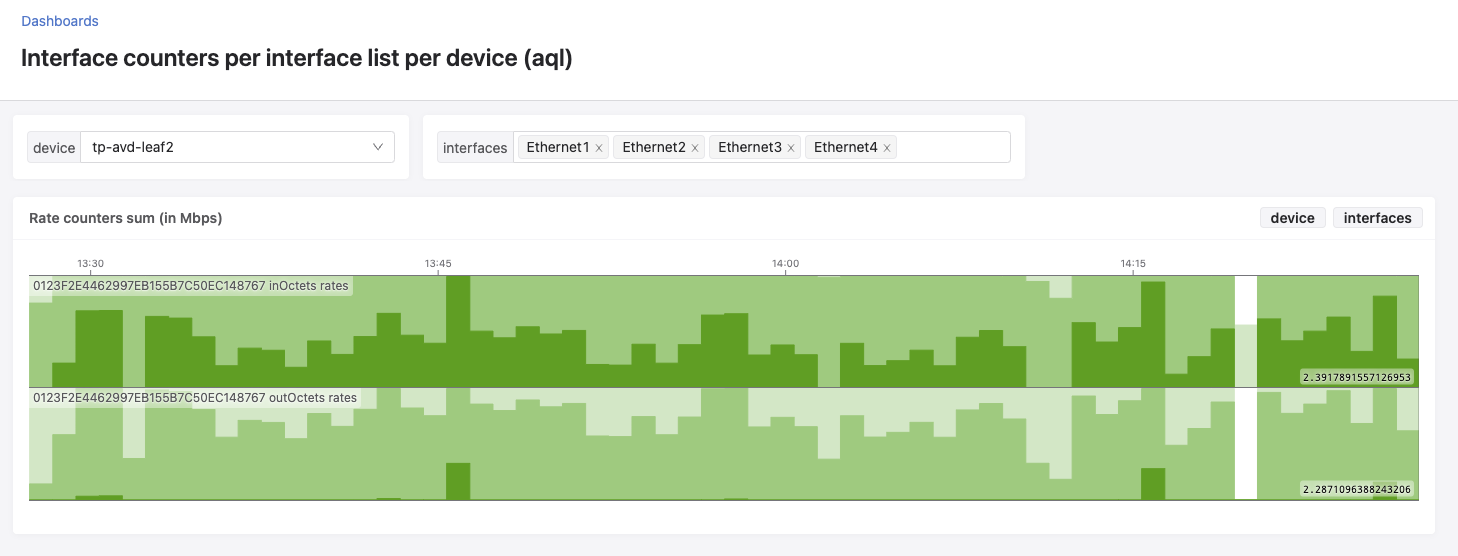
Interface counters sum per interface list per device
Note
Note that aggregate() function requires AQL revision 4+ to work.
# Get the 1 minute aggregate rate counters for the selected device
let data = `analytics:/Devices/<_device>/versioned-data/interfaces/data/*/aggregate/rates/1m`[_timeWindowStart:_timeWindowEnd]

# Filter out the rate counters to only contain the inOctets and outOctets key in two separate objects
let intfRatesInFiltered = data | map(_value | field("inOctets") | field("avg")) | where(dictHasKey(_interfaces, _key))
let intfRatesOutFiltered = data | map(_value | field("outOctets") | field("avg")) | where(dictHasKey(_interfaces, _key))

# Sum up the aggregates
let sumInOctets = aggregate(intfRatesInFiltered, "sum")
let sumOutOctets = aggregate(intfRatesOutFiltered, "sum")

# Add the result into a dictionary of timeseries for horizon graphs
# and divide the sum by 125000 to show the value in Mbps
newDict() | setFields(_device + " inOctets rates", sumInOctets/125000, _device + " outOctets rates", sumOutOctets/125000)
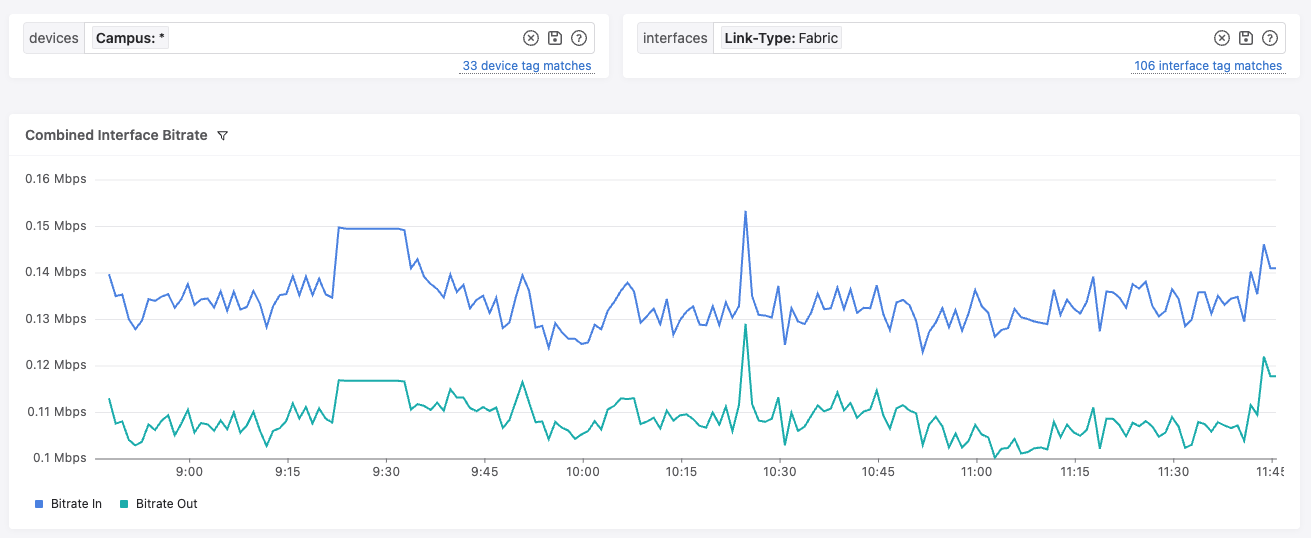
Combined bitrate for interfaces matching tag query
let raw = `analytics:/Devices/*_devices?/versioned-data/interfaces/data/*/aggregate/rates/1m`{"inOctets", "outOctets"}[_timeWindowStart:_timeWindowEnd]

let selected = newDict()

for device, intfs in _interfaces {
    if dictHasKey(raw, device) {
        let deviceData = raw[device]
        let selectedIntfs = newDict()

        for intf, value in intfs {
            if dictHasKey(deviceData, intf) {
                selectedIntfs[intf] = deviceData[intf]
            }
        }

        if length(selectedIntfs) > 0 {
            selected[device] = selectedIntfs
        }
    }
}

let inByInterfaceMbps = selected | recmap(2, _value | map(errvl(_value["inOctets"]["avg"], 0) * 8 / 1000000) | resample(1m))
let outByInterfaceMbps = selected | recmap(2, _value | map(errvl(_value["outOctets"]["avg"], 0) * 8 / 1000000) | resample(1m))

let inByDeviceMbps = inByInterfaceMbps | map(aggregate(_value, "sum"))
let outByDeviceMbps = outByInterfaceMbps | map(aggregate(_value, "sum"))

newDict() | setFields("Bitrate In", aggregate(inByDeviceMbps, "sum"), "Bitrate Out", aggregate(outByDeviceMbps, "sum"))
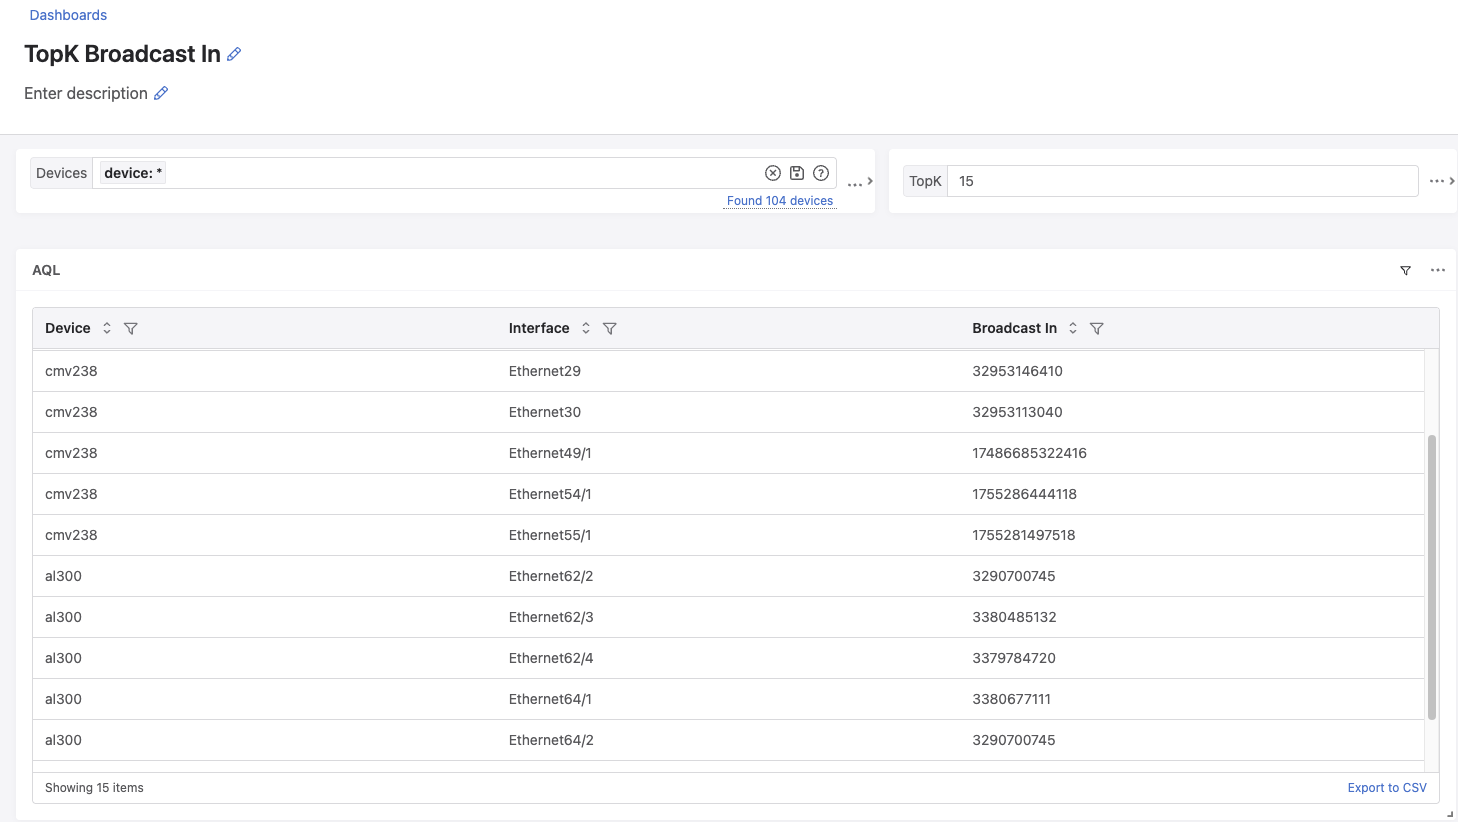
Top 10 Broadcast In packets across the network
# Get InBroadcasPkts_count for all interfaces on all filtered devices
let data = `analytics:/Devices/*_Devices?/versioned-data/interfaces/data/*/counters`{"inBroadcastPkts_count"}
let result = newDict()

for device, interfaces in data {
    for intf, ts in interfaces {
        let latest = merge(ts)
        if dictHasKey(latest, "inBroadcastPkts_count") {
            result[device + " / " + intf] = newDict() | setFields("Device", device, "Interface", intf, "Broadcast In", latest["inBroadcastPkts_count"])
        }
    }
}
# Put the top 10 in a table format (default is 10)
# change it from the TopK input
result | topK(_TopK, _value["Broadcast In"])